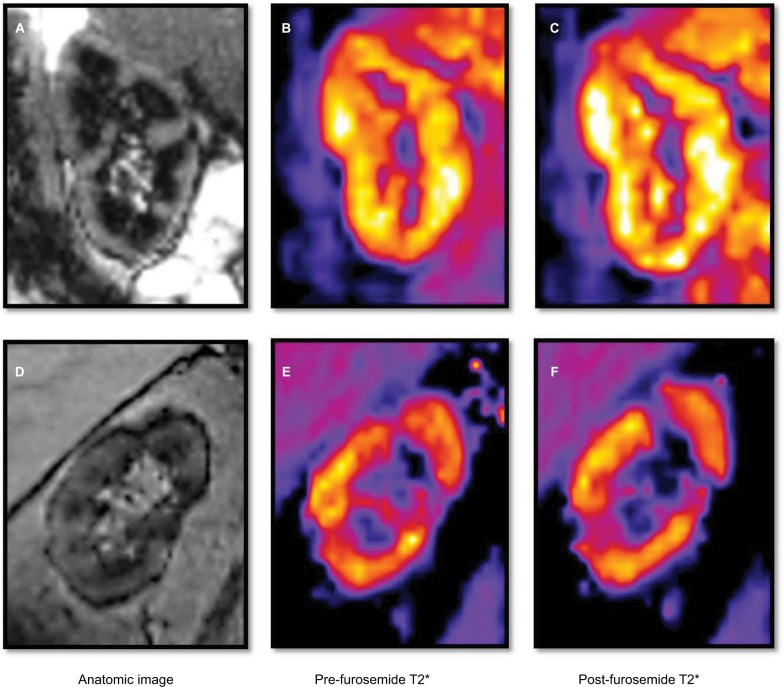
Figure 2.
Anatomic image (A) of the left kidney of a 77-year-old woman with hypertension and renal artery stenosis. The pre- (B) and post- (C) furosemide T2* images of the same kidney demonstrate a normal response and increase in post-T2* image intensity. Anatomic image (D) of the right kidney of a 75-year-old man with hypertension, diabetes and chronic kidney disease with an estimated glomerular filtration rate of 37 ml/min/1.73 m2. The pre- (E) and post- (F) furosemide T2* images of the same kidney demonstrate an abnormal response and decrease in post-T2* intensity.

