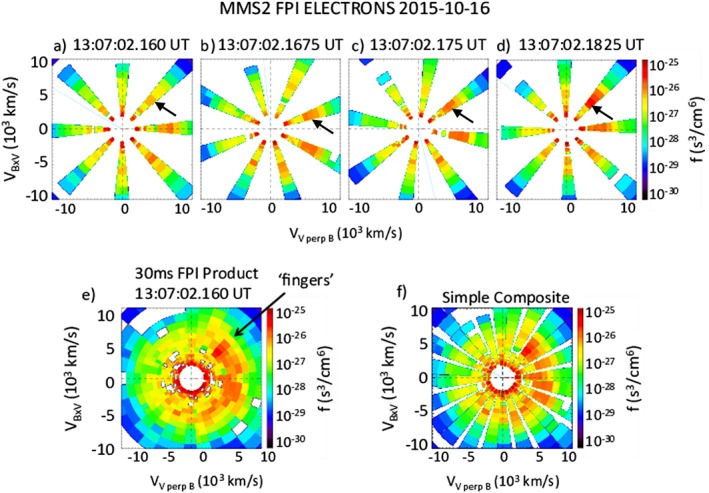
Figure 1.

(a–d) Four intermediate electron velocity distributions that are used to generate the 30 ms FPI electron velocity distribution. The sub‐30 ms changes in energy and intensity are highlighted by black arrows. (e) The FPI 30 ms electron velocity distribution highlighting the “fingers” structure in question. (f) The simple image composite of distributions (Figures 1a–1d) for comparison to the 30 ms distribution.
