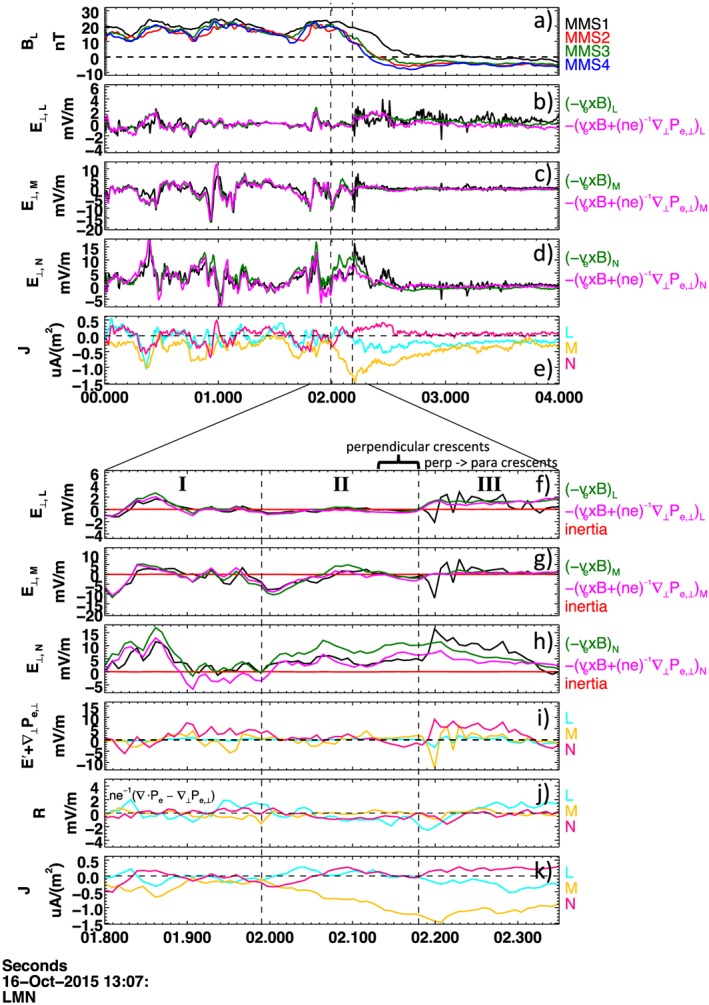
Figure 4.

Inclusion of the perpendicular electron pressure gradient, , results in reduced deviation from the perpendicular electric field (Figures 4b–4d and 4f–4h). The left and right vertical dashed lines indicate the onset of J M and J L, respectively. Excepting the magnetic field, for each measurement we use the four observatory average value. This is an approximation to the barycenter measurement, and for consistency in comparison to the four observatory average of electric field we use the 7.5 ms FPI calculation of the current density rather than the curlometer calculated value. Top panels include, in boundary normal coordinates, the (a) magnetic field, (b–d) observatory average perpendicular electric field compared with the components of the first two terms on the right‐hand side of equation (3), and (e) current via FPI. Bottom panels include a closer view of EDR region for the (f–h) observatory average perpendicular electric field comparison, (i) E ⊥+v e×B/c + (n e)−1∇⊥ P e,⊥, (j) residue defined as n e −1(∇·P e−∇⊥ P e,⊥), and (k) current via FPI. Boundary normal coordinates were calculated using the conversion matrix provided in Burch, Torbert, et al. (2016).
