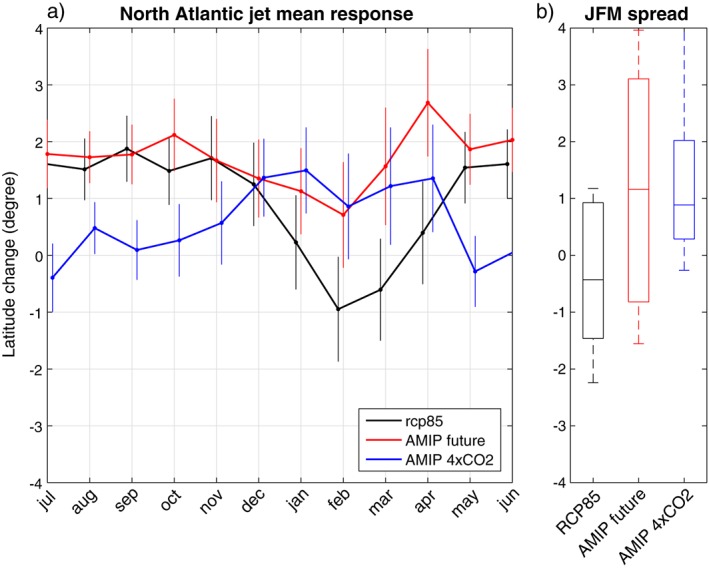
Figure 3.

(a) CMIP5 multimodel mean response (10‐model subset) in the North Atlantic jet latitude: RCP8.5‐historical (black), AMIPFuture‐AMIP (red), and AMIP4xCO2‐AMIP (blue). The vertical bars give 95% confidence intervals on the multimodel mean response due to internal variability. (b) Distribution of the mean JFM jet latitude response across the CMIP5 models. The horizontal bar gives the median, the boxes delimit the interquartile range, and the whiskers delimit the maximum range.
