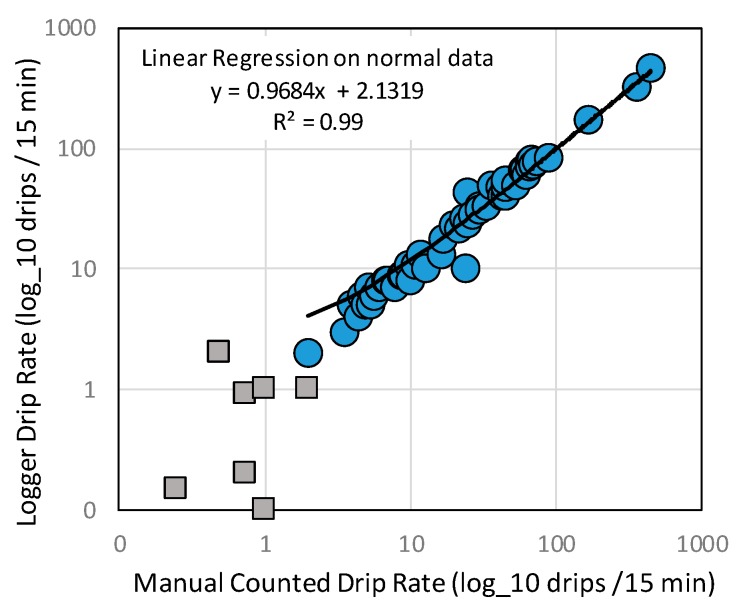
Figure 13.
Correlation between manually counted drip rate (shown as drips/15 min on X-axis) against number instrument counted drips (x/15 min on Y-axis). Linear regression on normal data has an R2 of 0.99, excluding counts where either manual or instrument reading is 1 drip or less/15 min (squares). Both axes shown as log_10.

