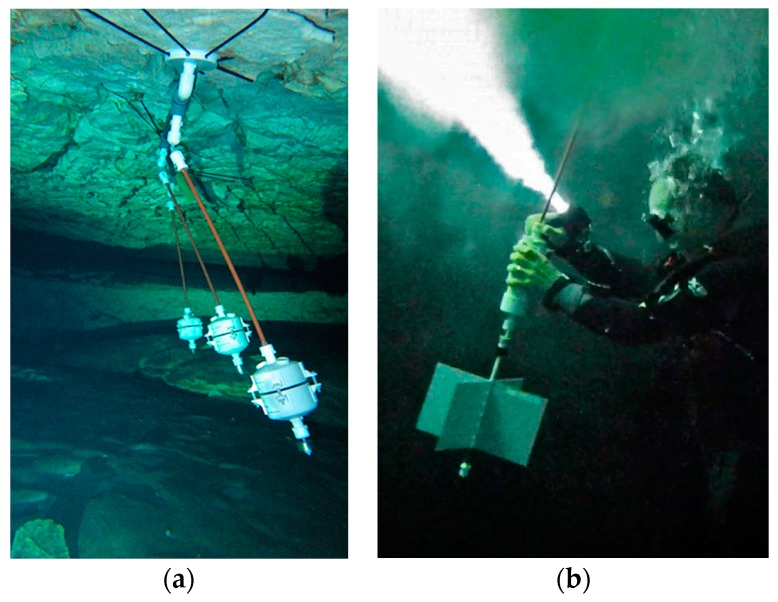
Figure 14.
Deployments of tilt flow meter: (a) An early flow meter installation in the Casa Cenote cave, at ~300 m from the blue hole discharge. Multi-logger deployments with ~1 m spacing allow assessment of inter-unit variability. Flow sensors are ballasted to slightly negative buoyancy, allowing soft bungee cord anchors that cause no damage to the cave. (b) High surface-area flags in low-flow conditions mechanically enhance the instrument response.

