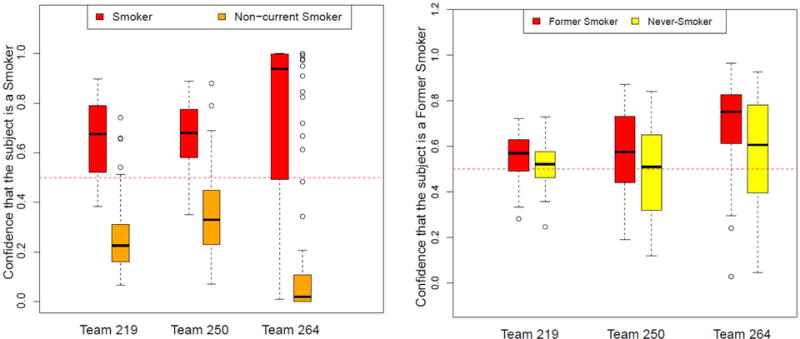
Figure 2. Classification confidence values for the top three teams in the sbv IMPROVER Systems Toxicology sub-challenge 2.

Data shown represent the confidence (0.0–1.0) that blood gene expression profiles belonged to a smoker (left) or former smoker (right). Distribution boxplots are shown by actual smoking status. Thick horizontal lines in the boxes represent median values, while the boxes encompass the first and third quartile.
