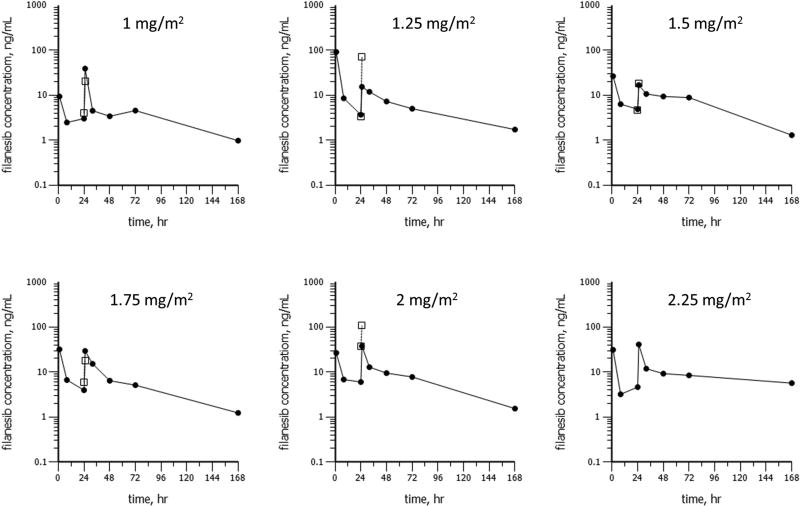
Figure 2.
Geometric mean plasma concentrations for filanesib as a function of time following filanesib administration as a 1-hour infusion on Day 1 and Day 2 (vertical gray lines) of Cycle 1 (closed circles) and Cycle 2 (open boxes). Plots are shown for doses of 1, 1.25, 1.5, 1.75, 2, or 2.25 mg/m2/day. Error bars represent ± one geometric standard deviation.

