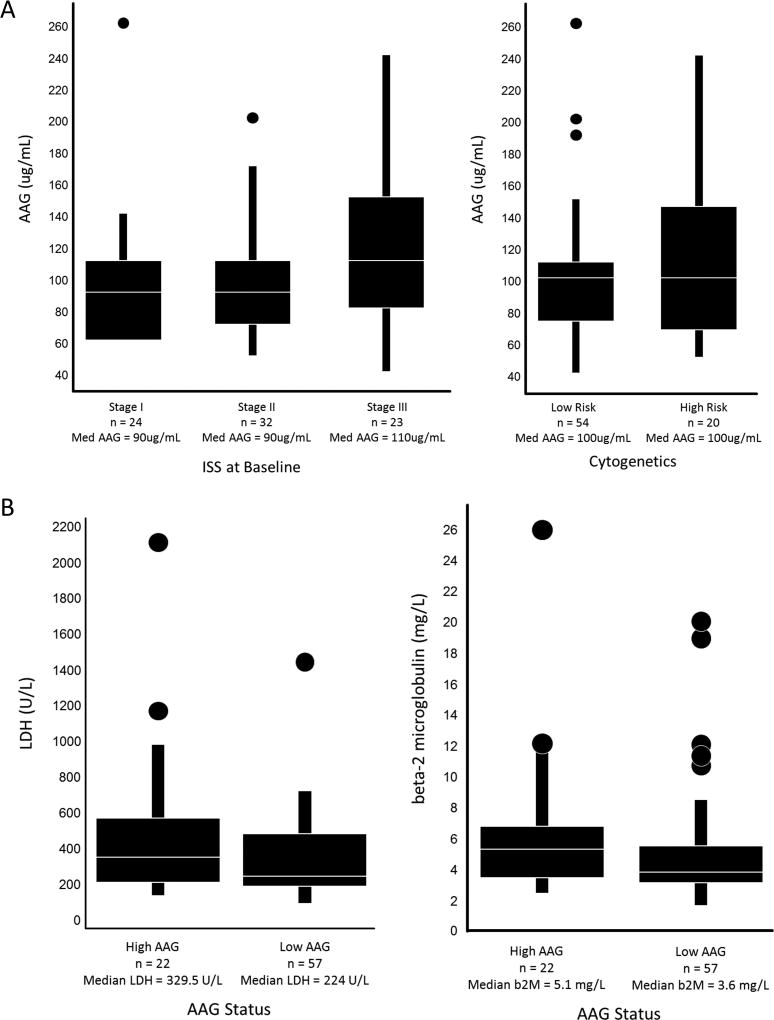
Figure 3.
(A) AAG vs Baseline ISS or Cytogenetics Status Box plots display median (Med) AAG levels. ANOVA was performed to test the differences in mean AAG in the 3 levels of ISS (p=0.062) or high/low risk cytogenetics (p=0.20). (B) Baseline LDH or beta-2 microglobulin (b2M) vs AAG Status. Box plots display median LDH or b2M levels. ANOVA was performed to test the differences in mean LDH (p=0.066) or mean b2M (p=0.15) by high/low risk patient AAG status.

