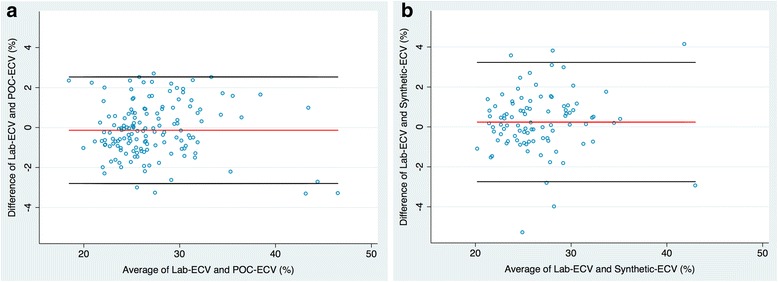
Fig. 3.

Bland-Altman plots of the mean differences between laboratory and point-of-care (POC) derived extracellular volume (ECV) (a) and laboratory and synthetic derived ECV (b). For each parameter in (a) and (b), the average of measurements from both techniques is plotted on the x-axis and the difference between techniques is plotted on the y-axis. The solid red horizontal line plots the mean difference and the solid black lines indicated the limits of agreement (differences from the mean of 1.96 SDs) for each parameter
