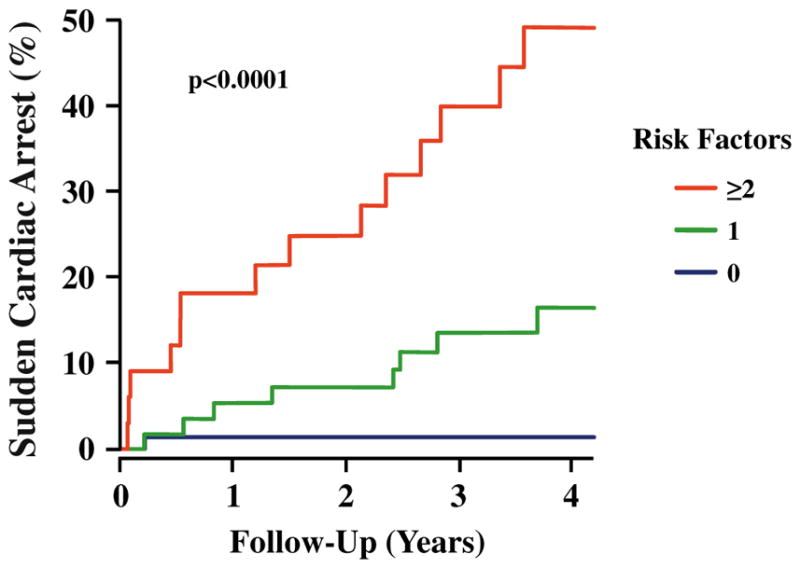
Fig. 4.

SCA risk factor model from PAREPET. Kaplan-Meier curves illustrating highly significant differences in the incidence of SCA in relation to the number of risk factors present (p<0.0001). Subjects with no risk factor (blue, 44 % of cohort) had an annual rate of SCA <1 %. With two or more risk factors (red, 20 % of cohort), the annual risk of SCA increased to ~12 %. Patients with one risk factor (green, 36 % of cohort) had an intermediate risk of SCA (~4 %/year). (Reprinted with permission from Elsevier [49••])
