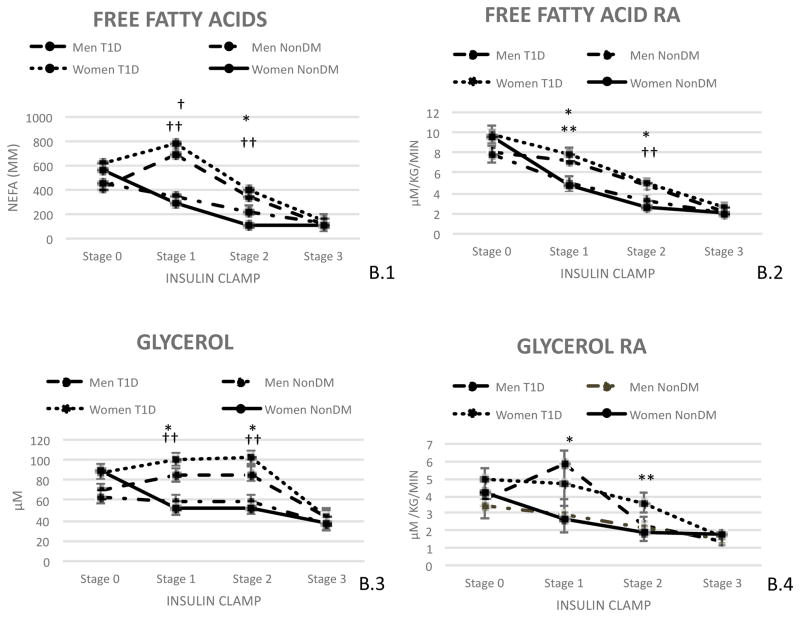
Figure B. Adipose Tissue Insulin Sensitivity.
(B.1) Non Esterified Fatty Acid levels by time and diabetes status, (B.2) Free Fatty Acid rate of appearance, (B.3) Glycerol by time and diabetes status, (B.4) Glycerol rate of appearance. Results are shown by sexes based on diabetes status. Results are expressed by least significant means (LSM).
*: P<0.05 Men with type 1 diabetes vs men without type 1 diabetes
†: P=0.0001 Men with type 1 diabetes vs men without type 1 diabetes
**: P<0.05 Women with type 1 diabetes vs women without type 1 diabetes
††: P=0.0001 Women with type 1 diabetes vs women without type 1 diabetes

