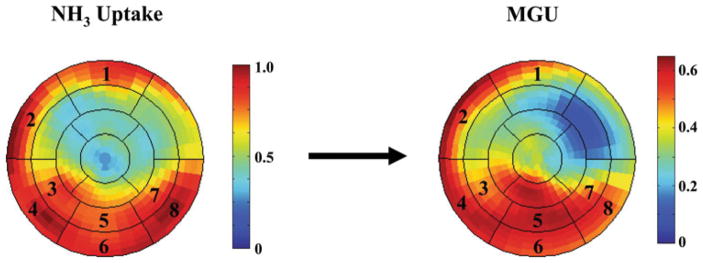
Figure 1.
Representative polar maps of NH3 uptake and MGU using FDG imaging. A 17-segment model of the LV and computational software (MyoPC®) was used to determine segmental uptake of 13N-ammonia. Segments with uptake ≥80% of the maximal segment were identified (i.e., segments 1–8 in this example) and considered to have normal perfusion. Myocardial glucose uptake (MGU, μmol/min/g) was quantified for these segments by the method of Patlak and Blasberg. The average MGU values in these segments as well as the maximal segment were determined for each subject.

