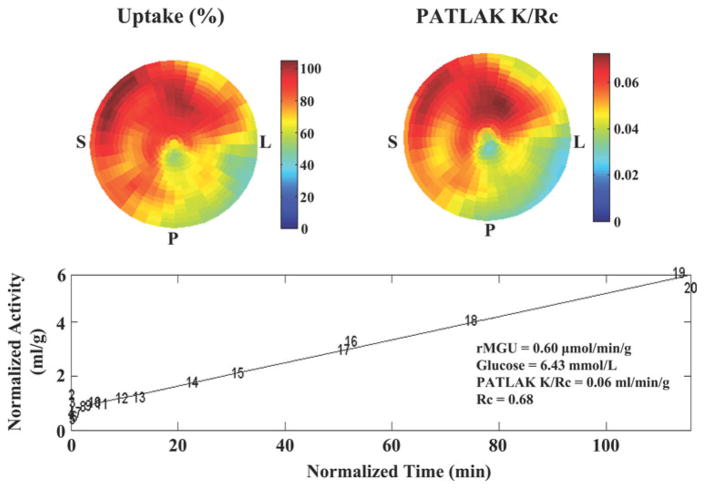
Figure 2.
MGU by Patlak analysis in a representative subject. The polar tomograms from FDG PET illustrate both regional uptake (upper left image) and kinetic modeling by Patlak analysis (upper right image). The lower graph confirms the linear relationship expected between the normalized myocardial activity and normalized blood-pool integral (Time). The net influx constant, Ki = K/Rc, which accounts for myocardial FDG uptake and phosphorylation, is determined from the slope (K) of the linear portion of this relationship, divided by a recovery coefficient (Rc) accounting for partial volume losses in the myocardium. Data points are labeled by frame number (1–20). S, Interventricular septum; P, posterior wall; L, lateral wall.

