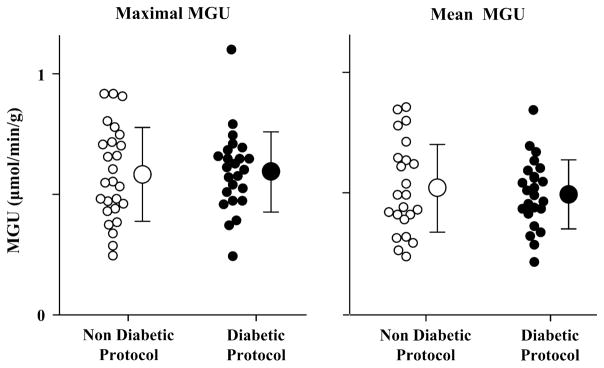
Figure 3.
MGU values in normally perfused segments of patients with ischemic cardiomyopathy. The maximal (left graph; Non-Diabetic: .60 ± .20 μmol/min/g, Diabetic: .60 ± .17 μmol/min/g) and mean (right graph; Non-Diabetic: .52 ± .18 μmol/min/g, Diabetic: .50 ± .14 μmol/min/g) MGU values for each subject are plotted relative to the HEC protocol used during FDG imaging. For both analyses, there were no differences in the range, scatter, or average MGU values between those subjects that underwent the Non-Diabetic (white circles) or Diabetic (black circles) protocols.

