Fig. 5.

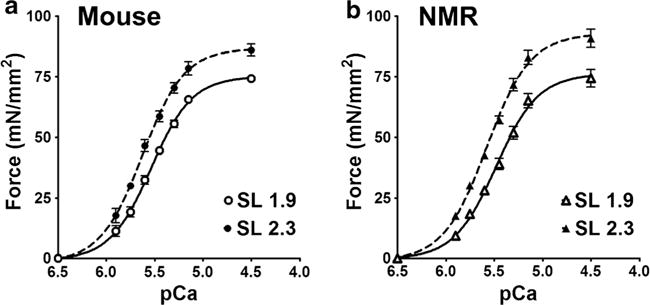
Force curves from steady-state force measurements on a mouse and b naked mole-rat cardiomyocytes at short (1.9 μm) and long (2.3 μm) sarcomere lengths (SLs). (n = 4 samples per species at each length, with n = 2–5 cardiomyocytes per sample)

Force curves from steady-state force measurements on a mouse and b naked mole-rat cardiomyocytes at short (1.9 μm) and long (2.3 μm) sarcomere lengths (SLs). (n = 4 samples per species at each length, with n = 2–5 cardiomyocytes per sample)