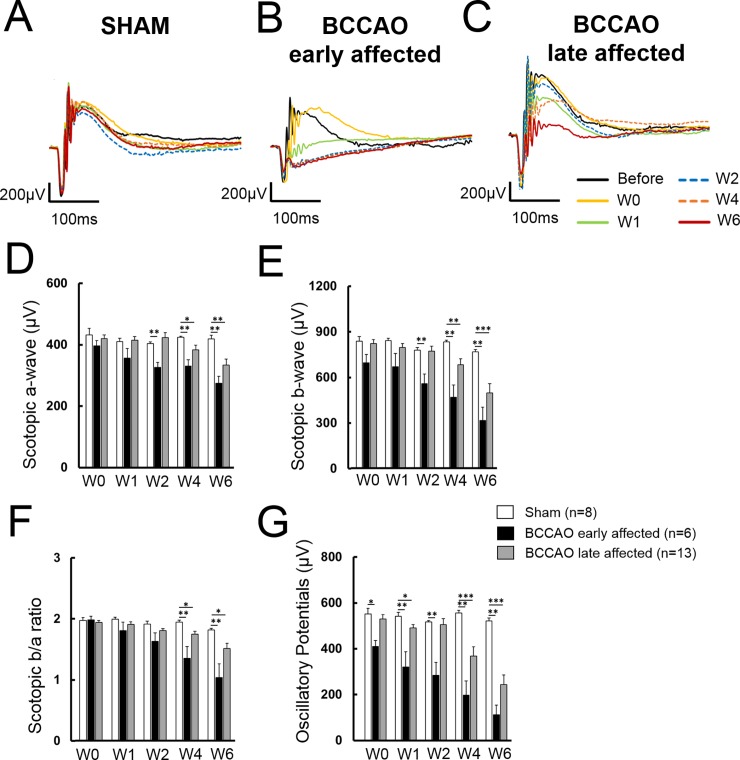
Fig 3. Analysis of temporal changes in visual function using Ganzfeld ERG.
A-C. Graphs show representative curves of Ganzfeld ERG during the experimental time-course of a (A) sham, (B) late affected BCCAO and (C) early affected BCCAO animals. D. Scotopic a-wave. E. Scotopic b-wave. F. b/a-wave ratio. G. Oscillatory potentials.

