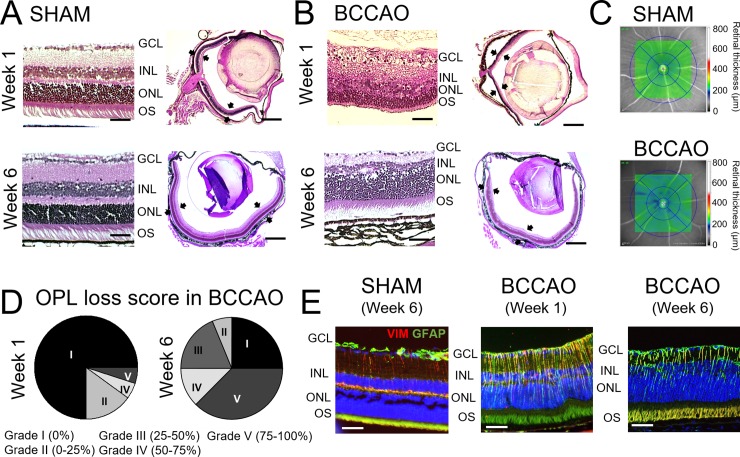
Fig 4. Structural changes in the retina after BCCAO.
A. Representative sagittal sections of the eye stained with H/E showing the retinal layers in a control eye. B. Representative sagittal sections of the eye stained with H/E showing structural alterations in the retinal layers 1 and 6 weeks after BCCAO. Scale bar on magnification = 100 μm; Scale bar on full retina = 500 μm. Black arrows indicate the retina. C. OCT retinal mapping of representative sham and BCCAO animals. Colorimetric scale indicates retinal thickness. D. Pie charts show distribution of the animals 1 or 6 weeks after BCCAO according to loss of the outer retinal layer (OPL). Grading is indicated in the figure according to percentages in OPL loss. E. Representative sagittal sections of the retina co-stained against GFAP (green) and VIM (red) showing Müller cells. Nuclei were counterstained with DAPI (blue). Scale bar = 50 μm.

