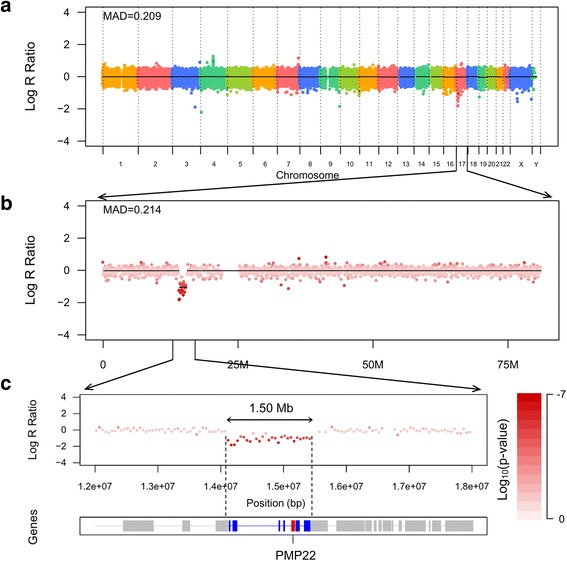
Fig. 1.

Combined log R ratio (LRR) plots of the 17p11.2 copy number variation (CNV) regions. a The panel shows a genome level LRR plot. b The panel shows the plot for chromosome 17. c The panel shows a detailed view of a CNV region in chromosome 17. Low values of LRR (less than − 1) indicate a deletion in the region of chromosome 17. MAD, median absolute deviation
