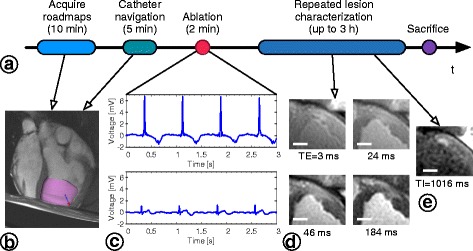
Fig. 1.

CMR-guided intervention experimental workflow. a Data acquisition and repeated lesion imaging performed throughout CMR-guided interventions. b Still frame of the actively-tracked catheter tip (blue and red arrow) during navigation overlaid on anatomical roadmap images in VURTIGO [22]. The LV endocardial surface (pink shell) was automatically delineated [41] and displayed to assist navigation. c Bipolar intracardiac electrogram (EGM) traces recorded from the catheter held at the ablation site immediately before ablation (upper panel) and approximately 3 s after stopping RF delivery (lower panel). d Anterior wall RF lesion visualized in T2-weighted images. Each stack of T2-weighted images was acquired at 4 TEs to construct T2 maps (16 s breath-holds, approximately 4 ± 2 min in duration), which were reconstructed offline, along with all image analysis. e RF lesion visualized in T1-weighted IR-SSFP. IR-SSFP images were acquired in a stack of several 2D images with each slice requiring 1 breath-hold 16 s long. Scale bars = 1 cm
