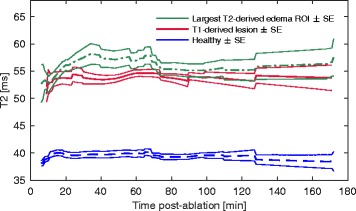
Fig. 7.

Longitudinal T2 post-ablation in healthy tissue, T2-derived edematous regions, and T1-derived lesions. Time course of: T2 in healthy tissue (n = 13 volumes); T2-derived edematous regions (n = 13); and T1-derived lesions (n = 8). Traces are shown for the time course corresponding to that shown in Figs. 4 and 5
