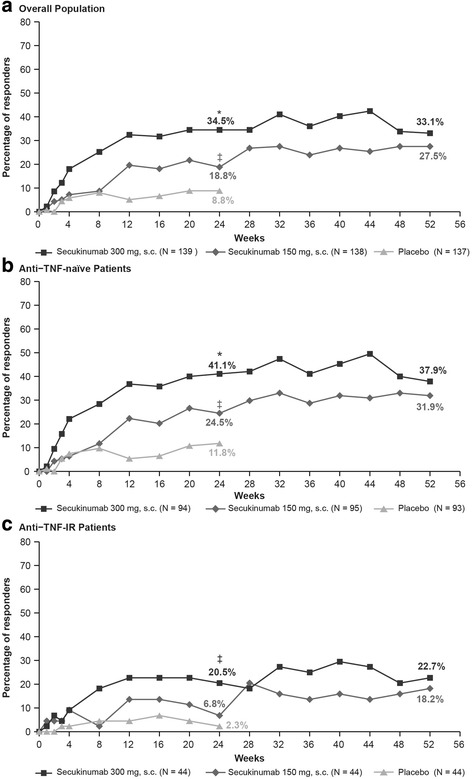
Fig. 3.

ACR50 response rates through week 52 in the overall population (a) and by anti-TNF status (b, c). *p < 0.0001, ‡p < 0.05 versus placebo. p values adjusted for multiplicity of testing for overall population at week 24. Missing values imputed as nonresponse (nonresponder imputation) through week 52. ACR50 50% improvement in American College of Rheumatology response criteria, IR inadequate response, s.c. subcutaneous, TNF tumor necrosis factor
