
Fig. 2.
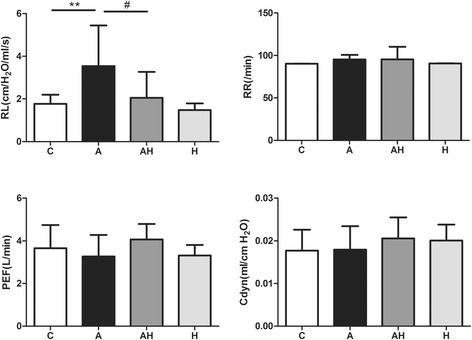
The effect of hydrogen gas inhalation on lung function in the asthmatic mouse model. C: control group (n = 10), A: asthma group (n = 10), AH: asthma plus hydrogen gas inhalation group (n = 10), H: control plus hydrogen gas inhalation group (n = 10). **: vs control group, P < 0.01; #: vs asthma group, P < 0.05