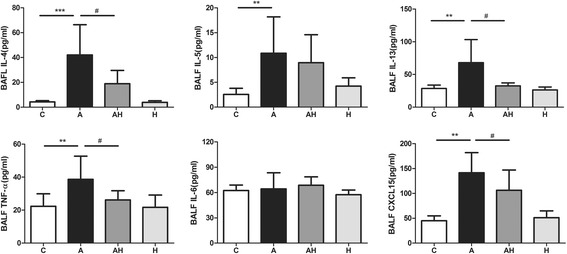
Fig. 5.

The concentration of inflammatory cytokines in the BALF in control animals (C, n = 10), asthmatic mouse model (A, n = 10), asthmatic mice with hydrogen gas inhalation (AH, n = 10) and control animals with hydrogen gas inhalation (H, n = 10). * P < 0.05, ** P < 0.01, *** P < 0.001 compared to the control group, # P < 0.05 compared to the asthma group
