
Fig. 4.
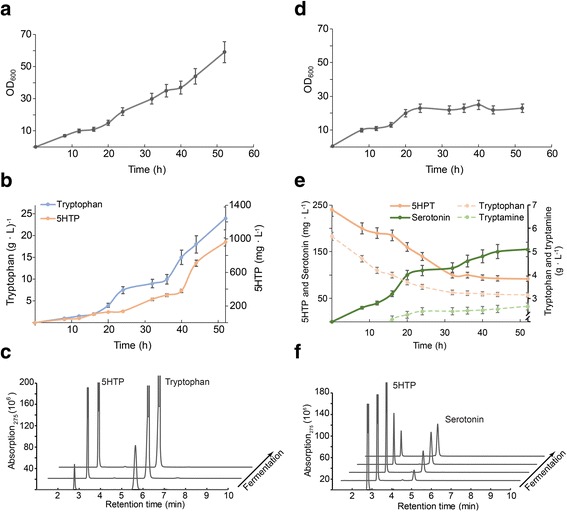
Serotonin production using a two-stage strategy. a and d growth curves; (b and e) production/consumption of tryptophan, 5HTP and serotonin. Side reaction (tryptophan conversion to tryptamine) is also indicated in panel e. with dashed lines; c and f HPLC retention pattern of tryptophan, 5HTP and serotonin; (a, b and c) panels correspond to the TrpD-Pl / pACJ23-CtAAAH-LC fermentation for the production of 5HTP from glucose; panels (d, e and f) correspond to the BL21(DE3) ΔtnaA / pCOLAJ23-TDC fermentation for the production of serotonin. Values in the graph are the average of triplicates, error bars correspond to the standard error of the mean (SEM)