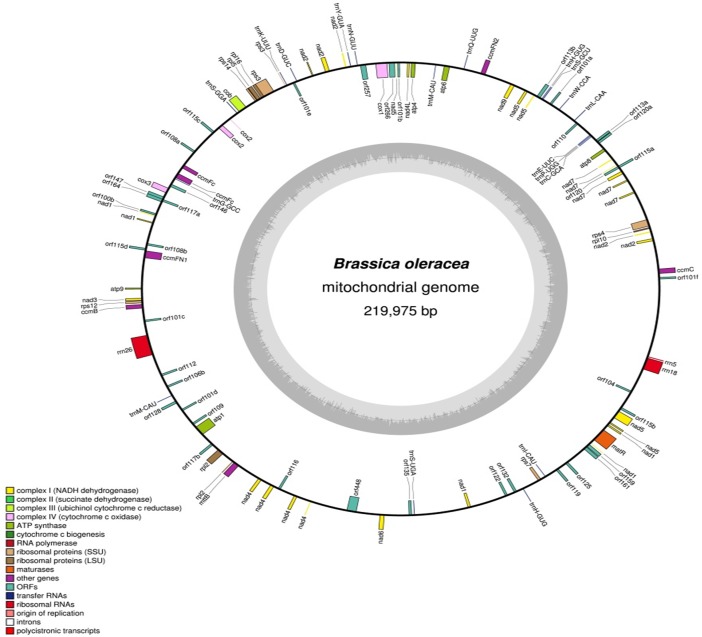
Fig 2. Map of the mitochondrial genome of B. oleracea var. capitata.
Boxes on the inside and outside of the outer circle represent ORF genes. Gene colors correspond to the functional categories listed in the legend. The inner circle displays the GC content represented by dark gray bars. The Fig was created using OGDraw v1.2 (adopted from [45]).

