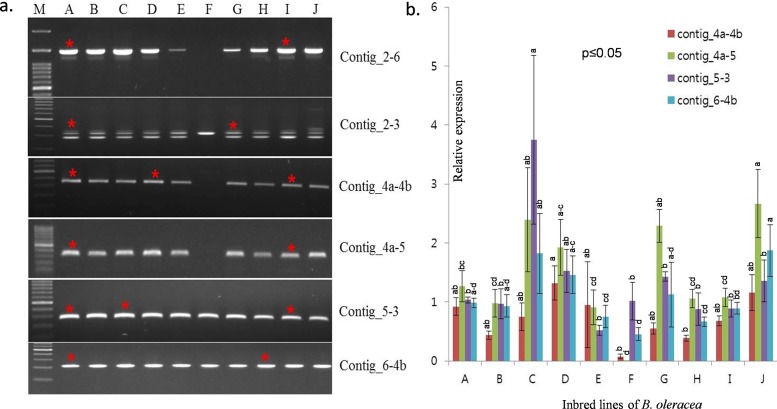
Fig 4.
In the left panel (a) identification of variation in the KU831325 mtDNA in various inbred lines. A, B, and E are cabbage, C is broccoli, D is kale, F is cabbage of the Ogura CMS line, G is cauliflower, H is brussels sprouts, I is kohlrabi, and J is kailan and M is the reference ladder with 100 bp. The genotypes with the red asterisks were used for cloning, sequencing, and assemblage of mitochondrial DNA in B. oleracea. There are two bands for contig 2–3, with the lower band being the target amplified according to the primer product size presented in Table 1. In right panel (b) showing relative expression with significant variation of different contigs/fragments present in different genotypes.

