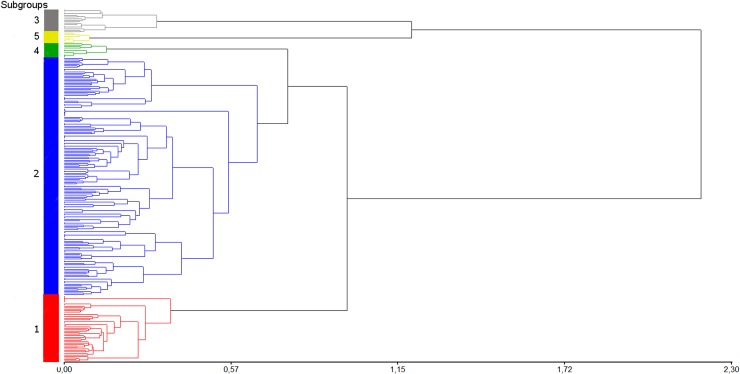
Fig 3. Dendrogram from Nei genetic distance matrix for 231 genotypes of the germplasm collection of INTA Balcarce potato breeding program.
Dendrogram of the whole population divided in clusters. In the X axe are represented the genetic distances between groups and individuals. In the Y axe are represented the subpopulations in which the population was divided.

