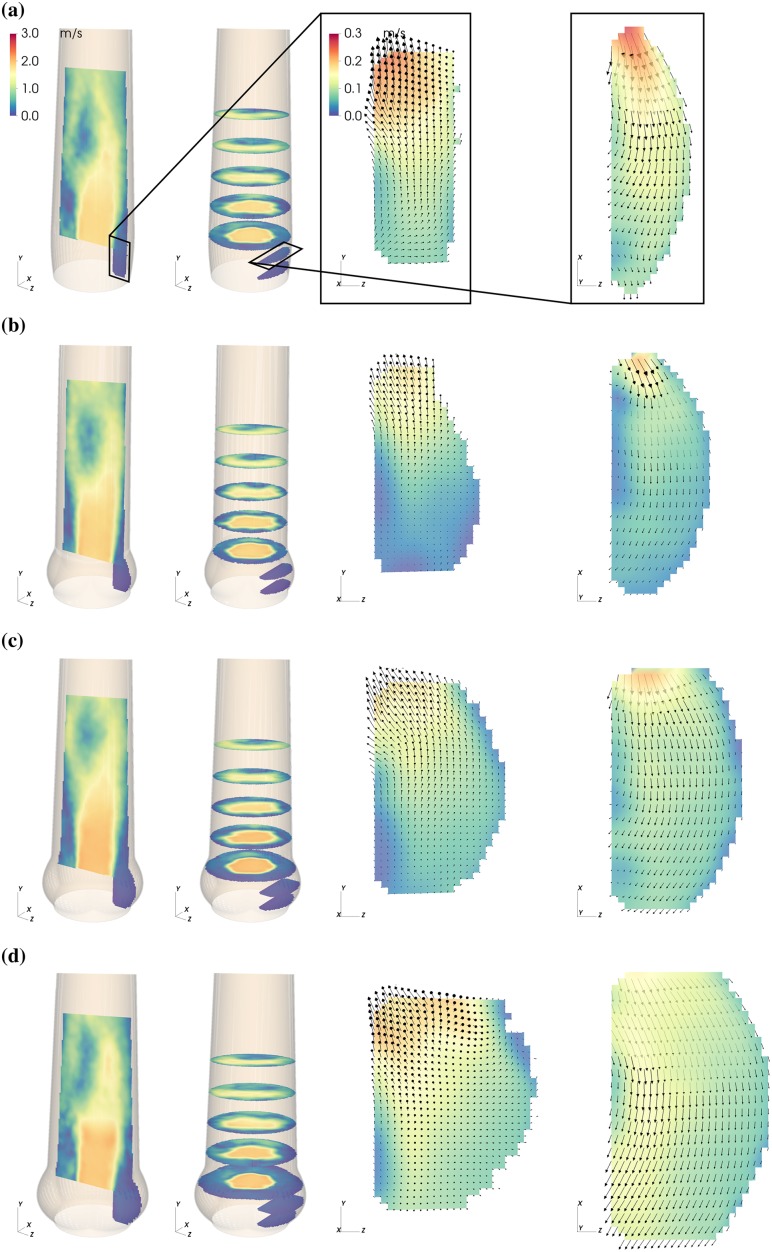
Fig 4. Mean flow fields in the AAo and in the SOV.
Mean velocity magnitude |〈U〉| in the NS (a), S (b), M (c) and L (d) aortic root configuration during mid-systole (t = 0.18 s. Each panel (a)—(d) shows axial and cross-sectiononal slices in the bulk flow downstream of the AVBP and a vertical and horizontal slice centered in the front-facing of the SOV.

