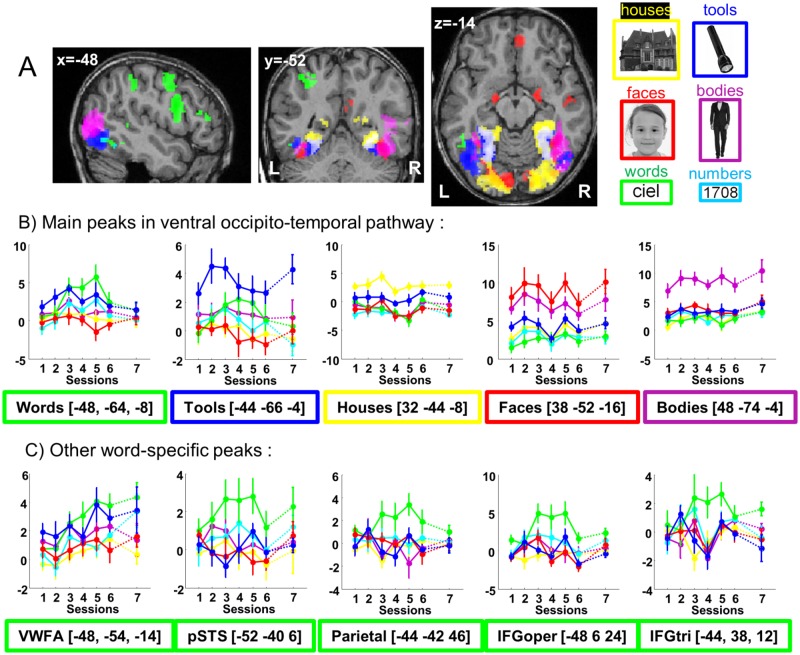
Fig 2. Category-specific activations across all 7 sessions and 10 children.
(A) Each category is contrasted relative to the other pictures (omitting the grids) while pooling across all 7 sessions. On the right, one example of each presented visual category. The color of the frame indicates the visual category of the specific activation on the slices and of the lines in the plots. The significant clusters (p < 0.001 corrected at the cluster level at p < .05) are presented over an individual child brain. No significant cluster was observed for numbers. See S2 Fig to see the activation for each category separately and S3 Fig for an example in an individual child (child 2). (B) Plots show the evolution over sessions of the betas for each category, at the primary peak in ventral visual cortex for each category and (C) at the peaks of the word specific activations in the whole brain. The first 6 sessions were evenly spaced during the first year of school, while the seventh session occurred at the end of the second year. Note that while the contrast used to create this image weighted all 7 sessions equally, plots revealed linear (e.g., VWFA) as well as quadratic (e.g., parietal, IFG) profiles, which are further analyzed in the text. (https://neurovault.org/collections/3457/). IFGoper, inferior frontal gyrus opercularis; IFGtri, inferior frontal gyrus triangularis; pSTS, posterior superior temporal sulcus; VWFA, visual word form area.

