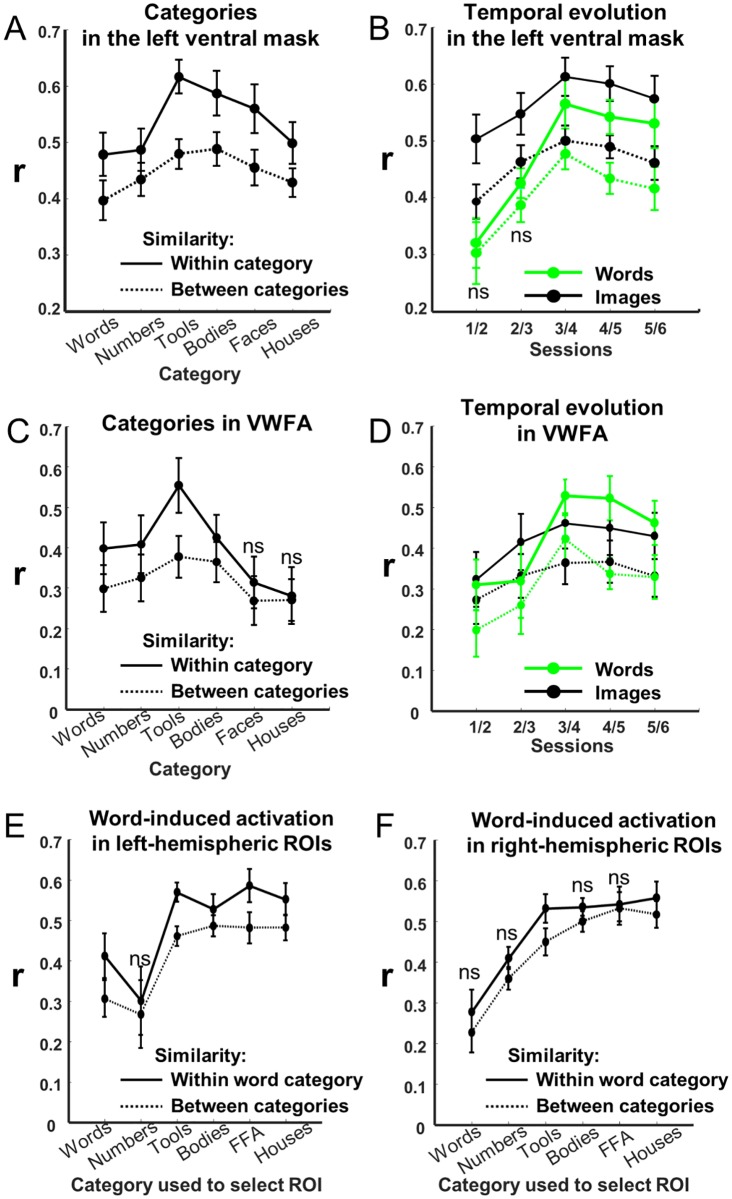
Fig 7. Representation similarity analysis.
In each graph, the thick line shows the within-category correlation coefficient r between 2 independently measured activation patterns, measuring the reproducibly of activation patterns in a given area, and the dotted line shows the between-category baseline (r was measured within each subject, then averaged; bar = ±1 standard error). A significant difference between those curves indicates a reliable category-specific activation. (A) When averaging over sessions, reliable patterns were present for all categories in the left ventral mask. (B) Temporal evolution across sessions of the r coefficient for words and for the average of nonsymbolic images (tools, bodies, faces, and houses) in the left ventral mask. (C) and (D), same as (A) and (B), restricted to the visual word form area. (E) and (F), similarity of the word-induced activation pattern in each ROI selective for a given category relative to others, respectively within the left and right ventral masks. All comparisons within versus between category are significant, except those indicated as ns. Underlying data found in S4 Data. FFA, fusiform face area; ns, nonsignificant; ROI, region of interest; VWFA, visual word form area.

