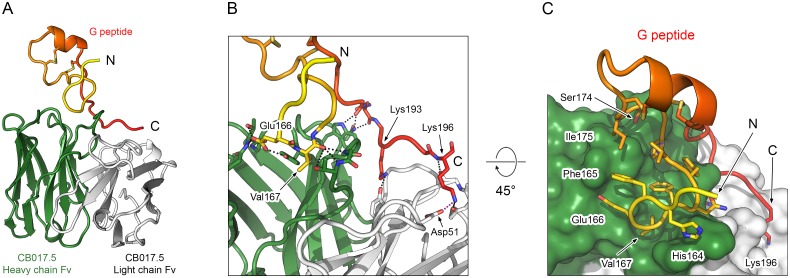
Fig 4. Crystal structure of Fab CB017.5 bound to an RSV G peptide.
(A) Ribbon diagram of the Fab CB017.5 variable domain (Fv) in complex with the subtype A RSV G peptide. (B) Ribbon-and-stick representation of Fab CB017.5 in complex with the G peptide. Black dotted lines indicate hydrogen bonds and the red dotted line indicates a salt bridge. (C) Ribbon-and-stick representation of the G peptide and a molecular surface representation of Fab CB017.5, rotated 45° from the view in (B). In panels (A–C) the heavy chain is colored green, the light chain is colored white, and the G peptide is colored on a spectrum from yellow to red, N- to C-terminus, respectively. For stick models, oxygen atoms are colored red, nitrogen are blue, and sulfur are yellow.

