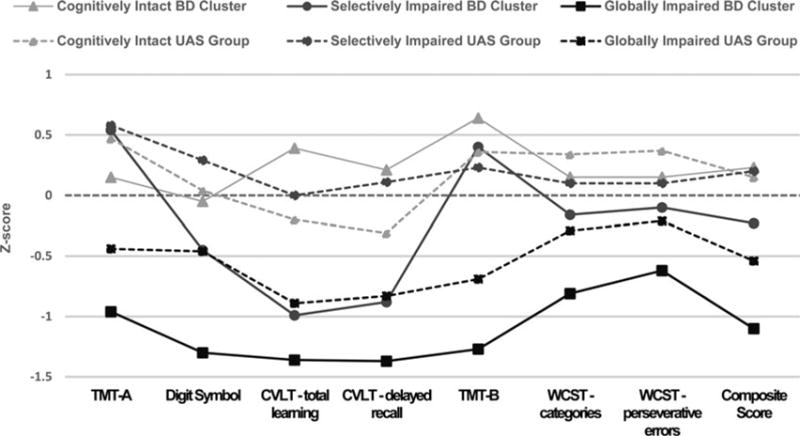
Fig. 2.

Profiles of the bipolar disorder (BD) clusters (continuous lines) and the unaffected sibling (UAS) groups (dotted lines) (49 pairs) based upon cognitive clusters. Note: manic (CARS-M) and depressive (HRSD) symptom ratings were used as covariates in the model. Dotted straight line represents the HC sample.
