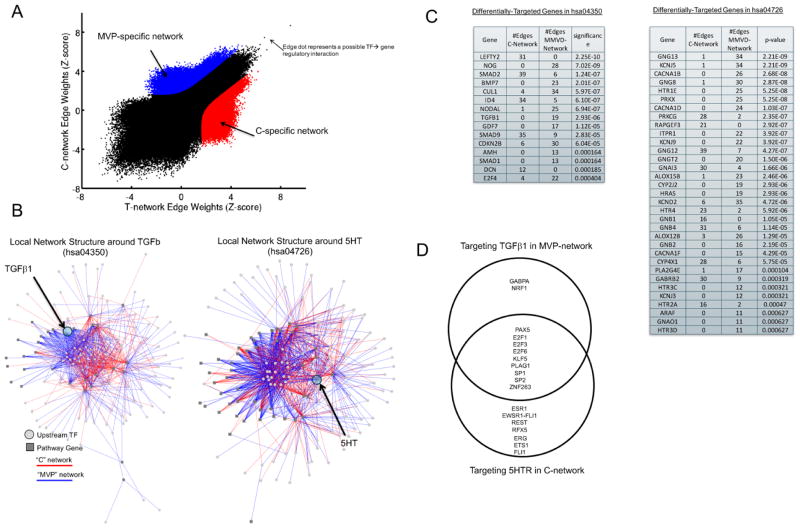
Figure 2. Regulatory Network reconstruction in MVP vs. Controls.
(A) A plot of the edge weights predicted by PANDA when reconstructing a regulatory network using the MVP or control expression data samples. On the plot, each point represents a potential transcription factor to target gene regulatory relationship. Regulatory edges that were identified as specific to either the MVP-network or the C-network are shown in red and blue, respectively. (B) Visualization of the MVP or C-specific sub-networks in which a member of either the TGFβ signaling pathway (hsa04350, left panel) or the serotonin pathway (hsa04726, right panel) are target genes. (C) The number of edges targeting members of the TGFβ signaling pathway or the serotonin signaling pathway in each of the two identified MVP-specific and C-specific sub-networks. The significance of any differential-targeting of these genes comparing the sub-networks is also shown. (D) A Venn diagram of the transcription factor regulators identified as targeting 5HT in the MVP-network and TGFβ in the C-network.

