Fig. 2.
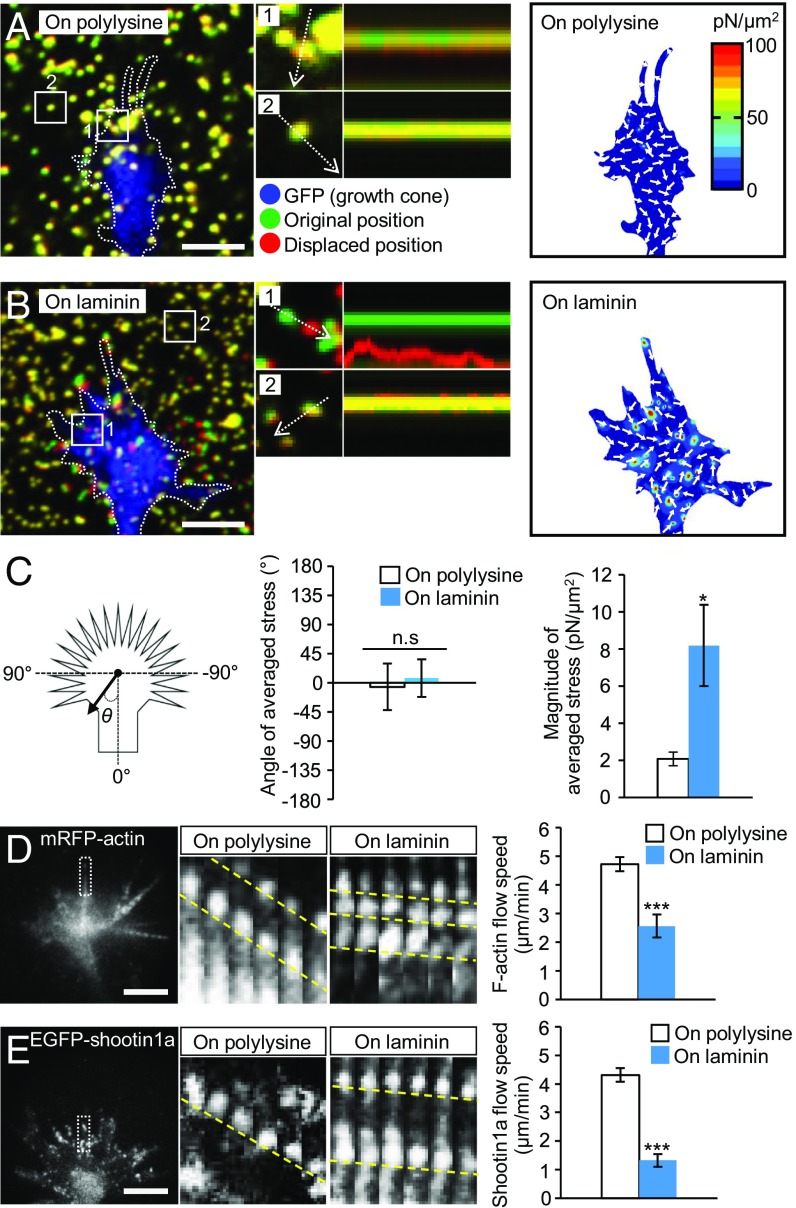
Laminin on the adhesive substrate promotes traction force and reduces retrograde flow of F-actin and shootin1a at growth cones. (A and B) (Left) Fluorescence images showing axonal growth cones of DIV1 neurons expressing GFP and cultured on (A) polylysine-coated or (B) laminin-coated polyacrylamide gel with embedded 200-nm fluorescent beads. The pictures show representative images from time-lapse series taken every 3 s for 147 s (Movie S2). The original and displaced positions of the beads in the gel are indicated by green and red colors, respectively. Dashed lines indicate the boundary of the growth cones. (Middle) The kymographs along the axis of bead displacement (white dashed arrows) at the indicated areas 1 and 2 of the growth cone show movement of beads recorded every 3 s. The bead in area 2 is a reference bead. (Right) The stress maps during the initial 30-s observations. (C) Statistical analyses of the angle (θ) and magnitude of the traction forces under axonal growth cones on polylysine-coated or laminin-coated polyacrylamide gel; n = 25 growth cones. The magnitude of the force produced on the laminin-coated substrate was significantly greater than that produced on polylysine, while the angles of the forces on polylysine and laminin were not statistically different from 0. (D and E) (Left) Fluorescent feature images of (D) mRFP-actin and (E) EGFP-shootin1a at axonal growth cones cultured on polylysine. (Middle) Kymographs of the fluorescent features of mRFP-actin and EGFP-shootin1a in filopodia on polylysine (boxed area) and laminin at 5-s intervals are shown (F-actin and shootin1a flows are indicated by dashed yellow lines) (Movies S3 and S4). (Right) Graphs show retrograde flow rates obtained from the kymograph analyses (n = 607 signals in D and 805 signals in E). Data in D and E represent means ± SEM; *P < 0.05; ***P < 0.01; ns, nonsignificant. (Scale bars: 5 μm.)

