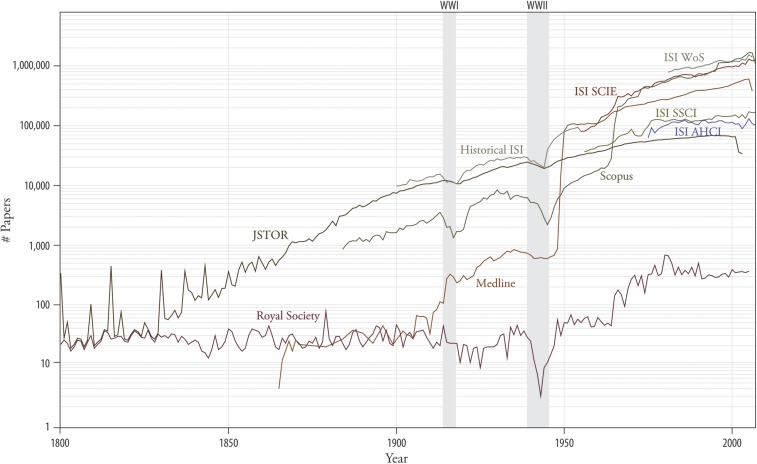
Fig. 1.
Accelerating growth of publications. The graph shows the number of papers (log scale) per publication year from 1800 to 2007 based on numerous data sources (see labels). The growth in papers is dominated by increases in recent years. Note the impact of World Wars I and II on scholarly productivity. Adapted from ref. 3. AHCI, Arts & Humanities Citation Index; ISI, Institute for Scientific Information; SCIE, Science Citation Index Expanded; SSCI, Social Sciences Citation Index; WoS, Web of Science; WWI, World War I; WWII, World War II.

