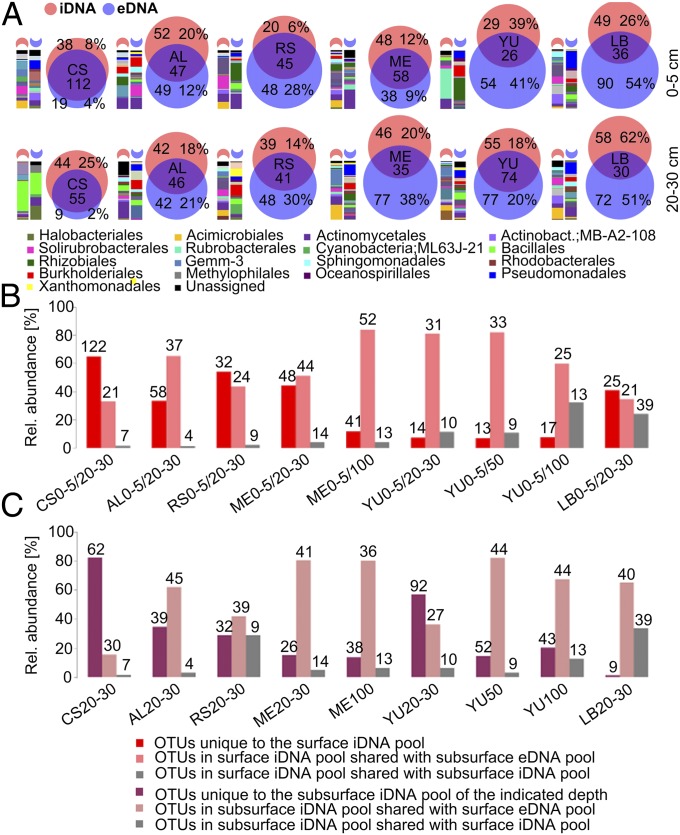
Fig. 2.
Microbial community structure and relationship between iDNA and eDNA pools at six soil sampling sites in the Atacama Desert: CS, AL, RS, ME, YU, and LB. (A) Venn diagrams of iDNA and eDNA OTU intersections for samples collected at 0–5 cm and 20–30 cm depth. Numbers indicate the numbers of different OTUs, and percentages refer to relative abundances of reads unique to iDNA or eDNA. Bars to the left of the Venn diagrams show relative abundances of bacterial orders in the subsets unique to the iDNA and eDNA pools of the indicated sampling depth. (B) Classification of iDNA pools from soil surface samples (0–5 cm) collected at the six sampling sites in comparison with the iDNA and eDNA pools in subsurface soil layers. (C) Classification of the subsurface iDNA pools (20–30 cm, 50 cm, 100 cm) in comparison with the iDNA and eDNA pools in the surface soils (0–5 cm). The bars show the percentages of OTU reads in the corresponding subsets, and numbers indicate the numbers of different OTUs.

