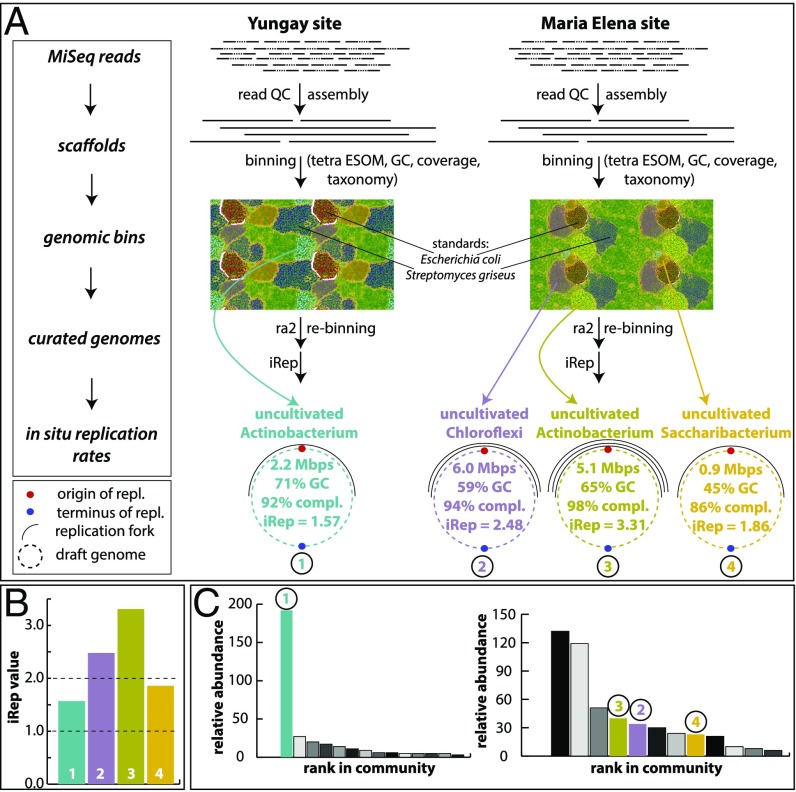
Fig. 3.
Genome-resolved metagenomics analyses and results. (A) Work flow and main results from genome-resolved metagenomics. For details please see SI Appendix, Read-Based Metagenomics, Genome-Resolved Metagenomics and in Situ Replication Rates. Genome replication forks are symbolic. (B) Overview of iRep values retrieved from the four genomes from the YU and ME sites (color codes correspond to those in A). Dashed line at value 1 marks threshold at which no replication occurs. Dashed line at value 2 marks where each genome of a population has on average bidirectional replication taking place (24). (C) Rank-abundance curves based on rpS3 genes. Colored genomes correspond to those in A and B. For the YU site (Left rank-abundance curve) the most dominant organism was reconstructed, and all other genomes were fragmented. For the ME site (Right rank-abundance curve) three genomes were reconstructed. The three most abundant organisms were Actinobacteria, which were similar in GC and abundance.

