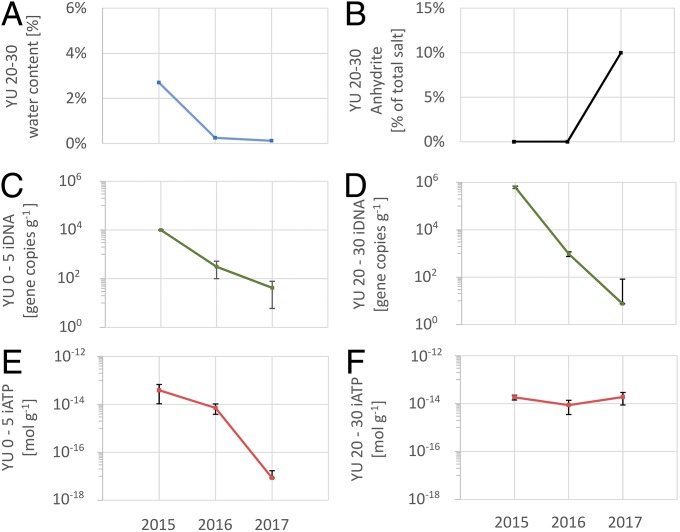
Fig. 4.
Comparison of sampling events of April 2015, February 2016, and January 2017 at YU. (A) Available nonstructural water decreases significantly from 2015 to 2017. (B) Some of the gypsum at YU 20–30 desiccated and formed anhydrite. (C and D) Intracellular DNA amounts indicative of living organisms drop by several orders of magnitudes at 0–5 cm and 20–30 cm depths. (E and F) Intracellular ATP amounts indicative of active organisms drop by several orders of magnitudes at 0–5 cm, but stay constant at 20–30 cm depth.

