Fig. 4.
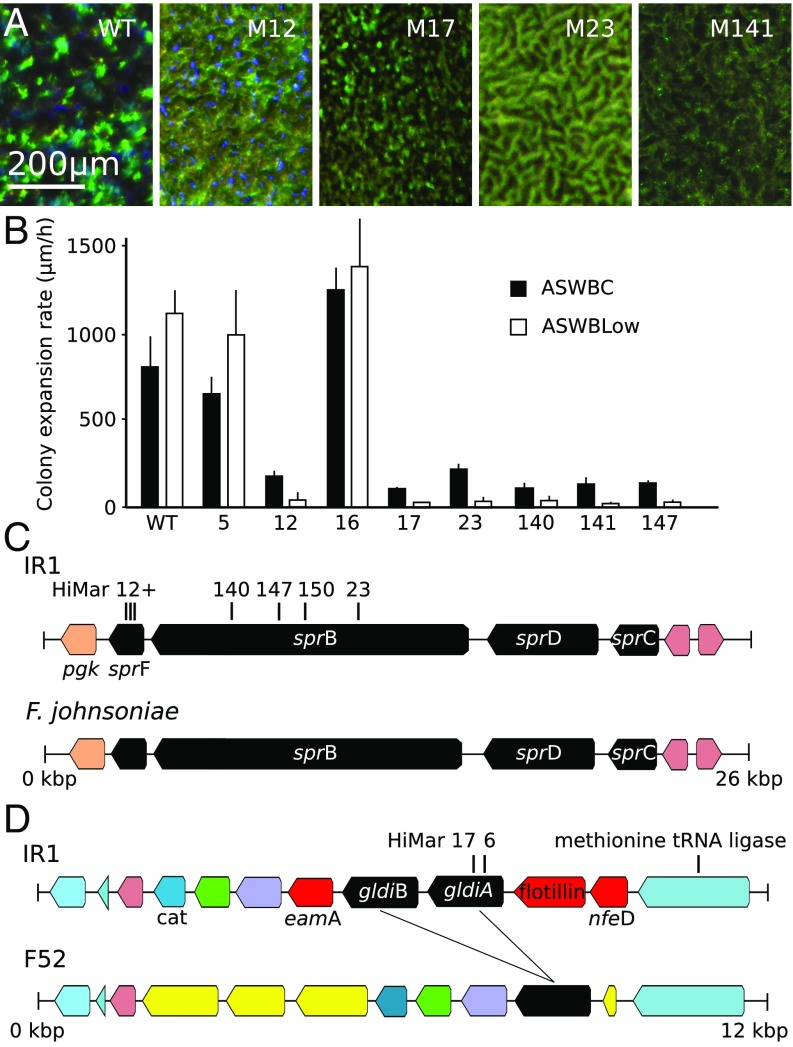
Phenotyping and mapping of transposon insertions affecting motility and iridescence. (A) Comparison of iridescence of WT IR1 and mutants viewed under the microscope and cultured on ASWBC agar overnight at 22°C. M12–M23 have been color enhanced since they would otherwise appear black in comparison. (B) The rate of colony expansion of the WT and mutant strains quantified on ASWBC and ASWVLow plates. (C) Mapping of transposon insertions of mutants 12, 23, 147, and 149 within the sprC–F gene cluster of strain IR1, showing close homology with a similar operon from F. johnsoniae UW101. (D) Mapping of mutants 6 and 17 within the gldiA gene of IR1 and comparison with the region of the Flavobacterium F52 genome that contains homologous genes (black, a single copy in F52 and two in IR1). Genes marked in yellow are found in this region only for F52. Genes in red (eamA, a flotillin motif-containing gene, and nfeD) are found in this region only in IR1. Other colors indicate ORFs found in this region in common between the two bacteria, including a putative methionine tRNA ligase upstream and the cat chloramphenicol resistance gene downstream.

