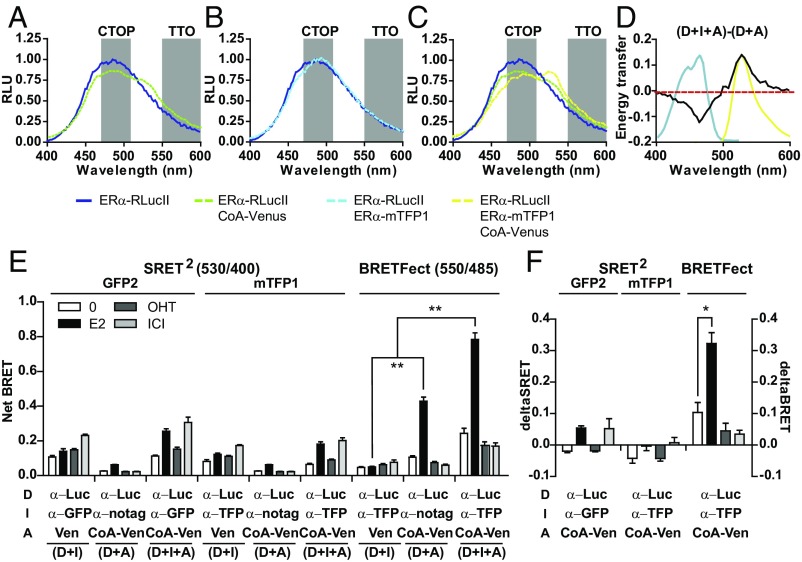
Fig. 2.
BRETFect monitors ternary complex formation between ERα dimers and coactivators in live cells. (A–C) Spectral analyses of luminescence emission by HEK293T cells expressing fusion proteins ERα-RLucII, ERα-mTFP1, and/or CoA peptide-Venus (CoA-Ven), or unfused versions of Venus or of ERα, and treated with E2 for 45 min. Values are the average of three biological replicates. (D) BRET signals for donor–acceptor (D + A) were subtracted from the BRET signals for the ternary condition (D + I + A) across the wavelength spectrum. The intermediate absorption spectrum (blue line) and the acceptor emission spectrum (yellow line) are superimposed. (E) Net BRET signals (530/400 nm in SRET2 and 550/485 in BRETFect) in cells expressing the indicated fusion proteins and/or unfused controls after treatment with ligands (1 μM) for 45 min. Coel-400a was used in SRET2 vs. coel-h in BRETFect. (F) Delta SRET and delta BRETFect were calculated as [(A + I + D) − (D + I) − (D + A)] from data in E. All graphs were prepared from at least three biological replicates, and error bars represent the SEM. Statistical significance was analyzed by ANOVA with a Bonferroni post hoc test. *P < 0.01, **P < 0.001.

