Fig. 6.
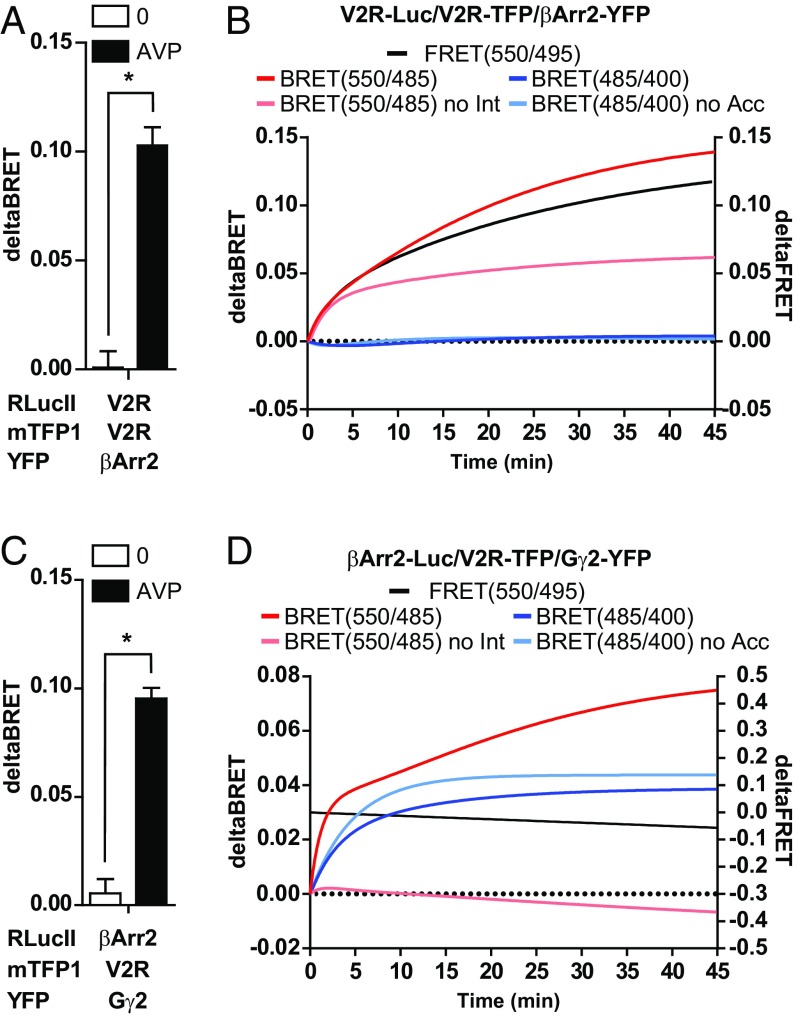
BRETFect detects formation of ternary complexes containing the GPCR V2R receptor and downstream effectors. (A) BRETFect assays in HEK293T cells expressing V2R fused to RLucII (donor), beta-arrestin2 fused to Venus (acceptor), and mTFP1-tagged V2R (intermediate). Delta BRET values were calculated from net BRET signals in Fig. S6A. (B) Time course of AVP induction of βArr2 recruitment to V2R in standard BRET (light red), BRETFect (dark red), or FRET (black) assays. Energy transfer between V2R molecules in a dimer is also shown in the presence (dark blue) or absence (light blue) of acceptor βArr2-Venus. Values represent the AVP-induced increase in signal over nontreated cells, calculated from data in Fig. S6 B and C. (C and D) BRETFect assays in HEK293T cells expressing βArr2-RLucII (donor), Gγ2-Venus (acceptor), and V2R-mTFP1 (intermediate). (C) Delta BRET values were calculated from net BRET signals in Fig. S6E. (D) Time course of AVP-induced recruitment of βArr2 to Gγ2 in the presence of V2R (BRETFect; dark red) or its absence (standard BRET; light red). Kinetics of FRET between V2R-mTFP1 and Gγ2-Venus (black line) and of βArr2 recruitment to V2R in the presence (dark blue) or absence (light blue) of acceptor Gγ2-Venus are also shown. Values represent the AVP-induced increase in signal over nontreated cells, calculated from data in Fig. S6 F and G. Graphs were prepared from three biological replicates, and error bars represent the SEM. Statistical significance was analyzed by ANOVA with a Bonferroni post hoc test. *P < 0.001. No Int, no intermediate; No Acc, no acceptor.

