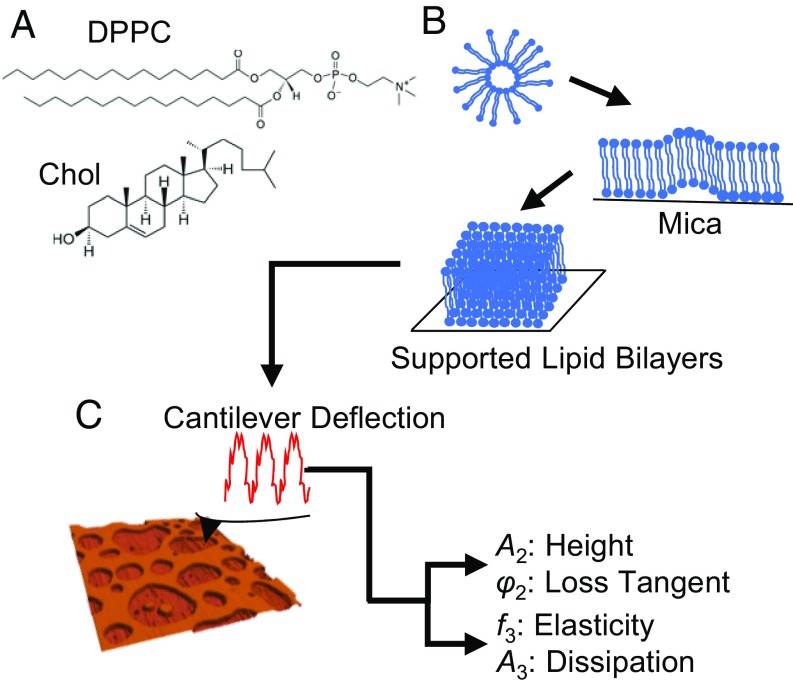
Fig. 1.
Schematic of the supported lipid bilayer (SLB) preparation. (A) Chemical structures of DPPC and Chol. (B) Diagram describing the SLB preparation process by vesicle fusion. (C) The schematic of operation for AM–FM AFM and a 3D topographical representation of the SLB. In brief, two separate excitation signals are combined to excite the cantilever resonances simultaneously. The resulting cantilever deflection is analyzed to determine the response at each resonance. The first resonance operates in normal tapping mode (AM mode). The amplitude A2 controls the vertical feedback loop for the standard tapping mode topography, while A2 and the phase φ2 give the values for the loss tangent. The second resonance operates in the FM mode. Changes in resonance frequency determine the elasticity, while changes in the amplitude A3 give the dissipation information.

