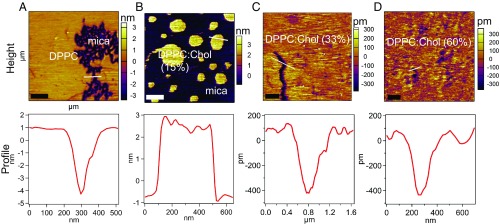
Fig. 2.
Topographical images and profiles of DPPC:Chol mixtures. The first resonance (AM mode) provides the topography of our model system at different Chol concentrations: (A) pure DPPC (scan size, 2.0 µm); (B) DPPC:Chol (15%) (scan size, 2.2 µm); (C) DPPC:Chol (33%) (scan size, 5.5 µm); and (D) DPPC:Chol (60%) (scan size, 2.9 µm). The height profiles corresponding to the lines drawn over the images displayed. [Scale bar: 500 nm (left-hand corner).]

