Fig. 1.
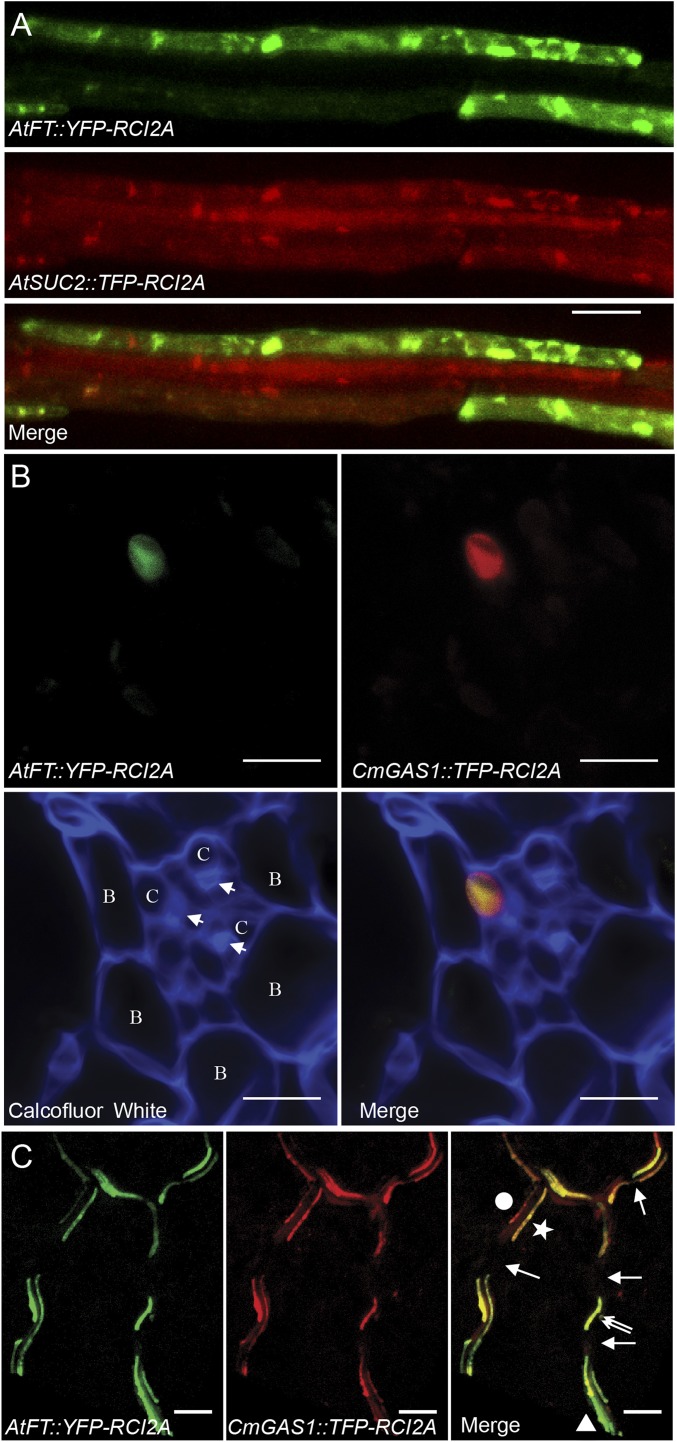
Localization of promoter activities in Arabidopsis veins by confocal microscopy. (A) Paradermal view from the top of the leaf. Cells that activate the AtFT promoter (AtFT::YFP-RCI2A) and the companion cell-specific AtSUC2 promoter (AtSUC2::TFP-RCI2A) fluoresce green and red, respectively. (B) Transverse hand section of a minor vein. Cell walls are made visible at the bottom by Calcofluor white staining (blue fluorescence). Fluorescence from the AtFT (green) and CmGAS1 (red) promoters overlap in a single companion cell. B, bundle sheath cell; C, companion cell. The arrowhead indicates a sieve element. (C) Low-magnification, paradermal views of veins from the upper side of the leaf illustrating superimposition of AtFT (green) and CmGAS1 (red) promoter activities. Each vein is apparent as two adjacent, parallel files of cells. The circle and star in the merged image are placed on opposite sides of a single vein, in which two files of companion cells run parallel to each other. Note that the cell closest to the dot activates the CmGAS1 promoter more strongly that the AtFT promoter. The companion cell indicated by the triangle in the bottom right of the image activates the AtFT promoter more strongly than the CmGAS1 promoter. In all veins, gaps in staining are evident, indicating weak or no promoter activity in either of the companion cells (arrows). In some locations in a vein, there is little if any staining in one of the two companion cells (double arrows), as is also seen in B. Tissues in A and C were cleared with ClearSee. (Scale bars: 10 µm in A and B; 50 µm in C.)

