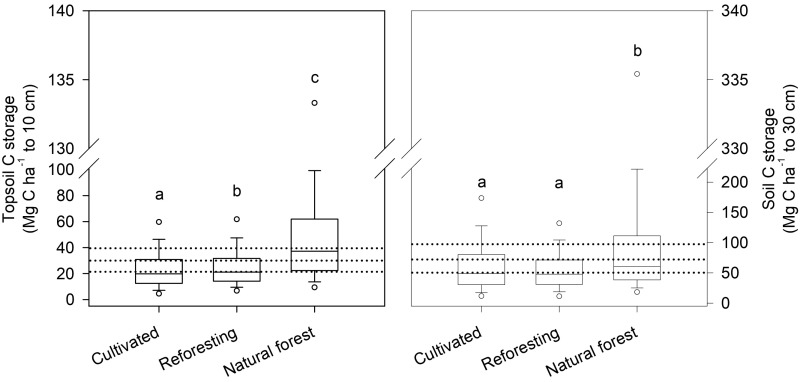
Fig. 3.
Topsoil C stocks are least under cultivation, greatest in natural forest, and intermediate on reforesting soils (Left); soil C stocks to 30 cm only differ significantly between cultivated and natural forest land uses (Right). Data are from ISCN-NLCD sites (n = 12,617). See Fig. 2 for box, whisker, and dot information. Within each depth, superscripts denote significant differences (P < 0.05) in median C stocks between land uses. The dotted lines in each figure are intended to aid in visual reference and show thresholds that are 5%, 50%, or 100% greater than cultivated baseline levels.

