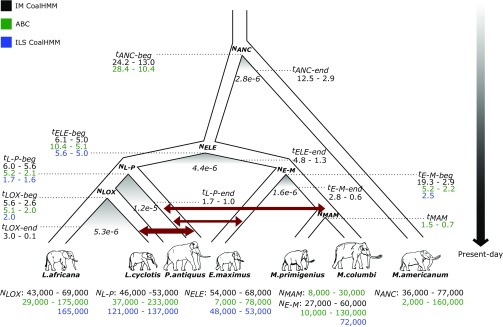
Fig. 3.
A consensus demographic model for the history of elephantids. Inferred parameters from three modeling approaches are shown: (i) coalescent simulations with approximate Bayesian computation (ABC), (ii) incomplete lineage sorting analysis (ILS CoalHMM), and (iii) isolation-and-migration models (IM CoalHMM). Dark red arrows indicate gene flow as inferred from the ABC analysis, with arrow thickness corresponding to the extent of gene flow. Shaded areas below the separation of species indicate a limited period of gene flow between incipient species as inferred from the IM CoalHMM analysis. Gene flow rate is shown below the shaded areas as the fraction of migrations per lineage per generation. Effective population sizes (Nx) and split times (tx) correspond to the 95% confidence intervals obtained from the ABC analysis (green), the mean estimates obtained from the ILS CoalHMM analysis (blue), and the bootstrap intervals obtained from the IM CoalHMM analysis (black). Split times are given in million y before present, with tx-beg referring to the initial split time and tx-end to the end of the migration period (for the IM CoalHMM analysis). LOX refers to the common ancestor of savanna and forest elephants, L-P to the common ancestor of Loxodonta and straight-tusked elephants, MAM to the common ancestor of woolly and Columbian mammoths, E-M to the common ancestor of Asian elephants and mammoths, ELE to the common ancestor of all elephantids, and ANC to the common ancestor of elephantids and the American mastodon. Branch lengths, splits, and migration rate periods are not drawn to scale.

