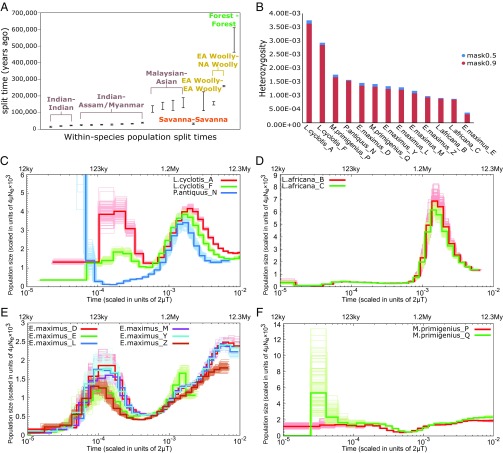
Fig. 4.
Population size history, heterozygosity and within-species population split times. (A) Within-species population split time ranges (95.4% confidence intervals) as estimated from the F(A|B) analysis, assuming a mutation rate (µ) of 0.406 × 10⁻⁹ per year and a generation time of 31 y. Confidence intervals of split times from reciprocal elephantid-pairs are combined and shown as a single interval. EA Woolly indicates the two Eurasian woolly mammoths (M. primigenius_P and M. primigenius_Q) and NA Woolly the North American (Mammuthus_V) woolly mammoth. (B) Individual autosomal heterozygosity estimated with the 90% mappability filter and the less stringent 50% mappability filter (see SI Appendix, Note 13 for more details). (C–F) PSMC inference of effective population size changes through time (bold curves) from high-coverage individual genomes of (C) forest and straight-tusked elephants, (D) savanna elephants, (E) Asian elephants, and (F) woolly mammoths. Bootstrap replicates are indicated by the soft-colored curves. Time is given in units of divergence per base on the lower x axis and in years before present on the upper x axis, assuming the mutation rate and generation time mentioned above. Population size is given in units of 4µNe × 103 on the y axis.

