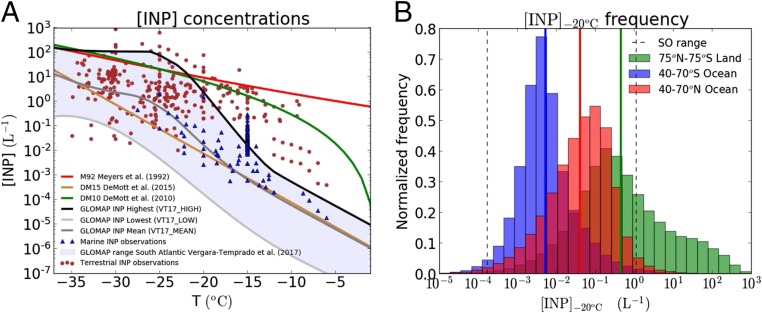
Fig. 2.
INP concentrations. (A) Various parameterizations used in our simulations. The dataset used in the work by Vergara-Temprado et al. (24) is shown for comparison (marine and terrestrial INP) (Supporting Information). The points are divided between marine and terrestrial locations. (B) Frequency distribution of daily averaged INP concentrations at an activation temperature of −20 °C for mid- to high latitudes for ocean regions in the Northern Hemisphere and the Southern Hemisphere between 850 and 600 hPa. INP concentrations over land (whole globe from 75° N to 75° S at the same altitudes) are also shown for comparison. The solid vertical lines show the median values of the distributions. Note that the INP model is subject to low biases over continental regions (24), and therefore, the actual values over land are probably higher.

