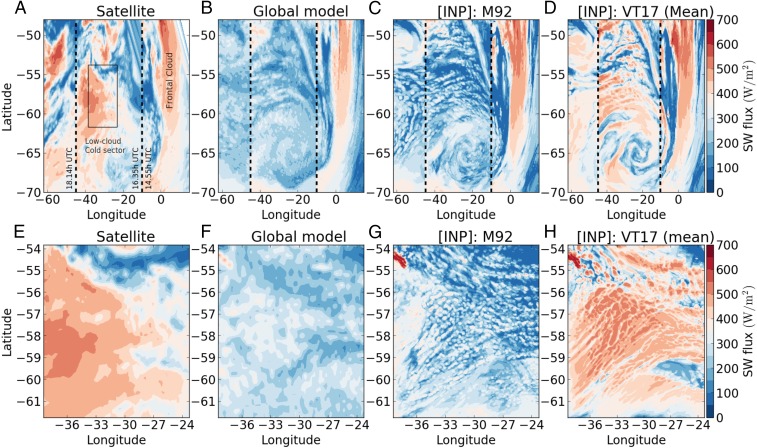
Fig. 3.
Top-of-atmosphere outgoing SW radiation for the observed and simulated clouds. Results show the first cloud system C1 with different representations of INP. A–D show the 0.07° grid-spacing simulations of the whole cyclone collocated with the satellite observations (A). A–D are divided by two black dashed lines into three areas, each corresponding to a different satellite retrieval. A box is drawn in the satellite image in A to show the position of the 2.2-km resolution domains (E–H). A and E correspond to the satellite data (CERES). B and F show the output of the global model, and C, D, G, and H are for the high-resolution runs using the M92 INP scheme and the mean INP values simulated from VT17. Fig. S6 shows all of the cases studied.

